Run reports
One per run, with a card per metric showing how many products changed.
Each monitoring run writes a report of what it read and what changed. Compare any two, follow one product through time, and export it all to Excel.
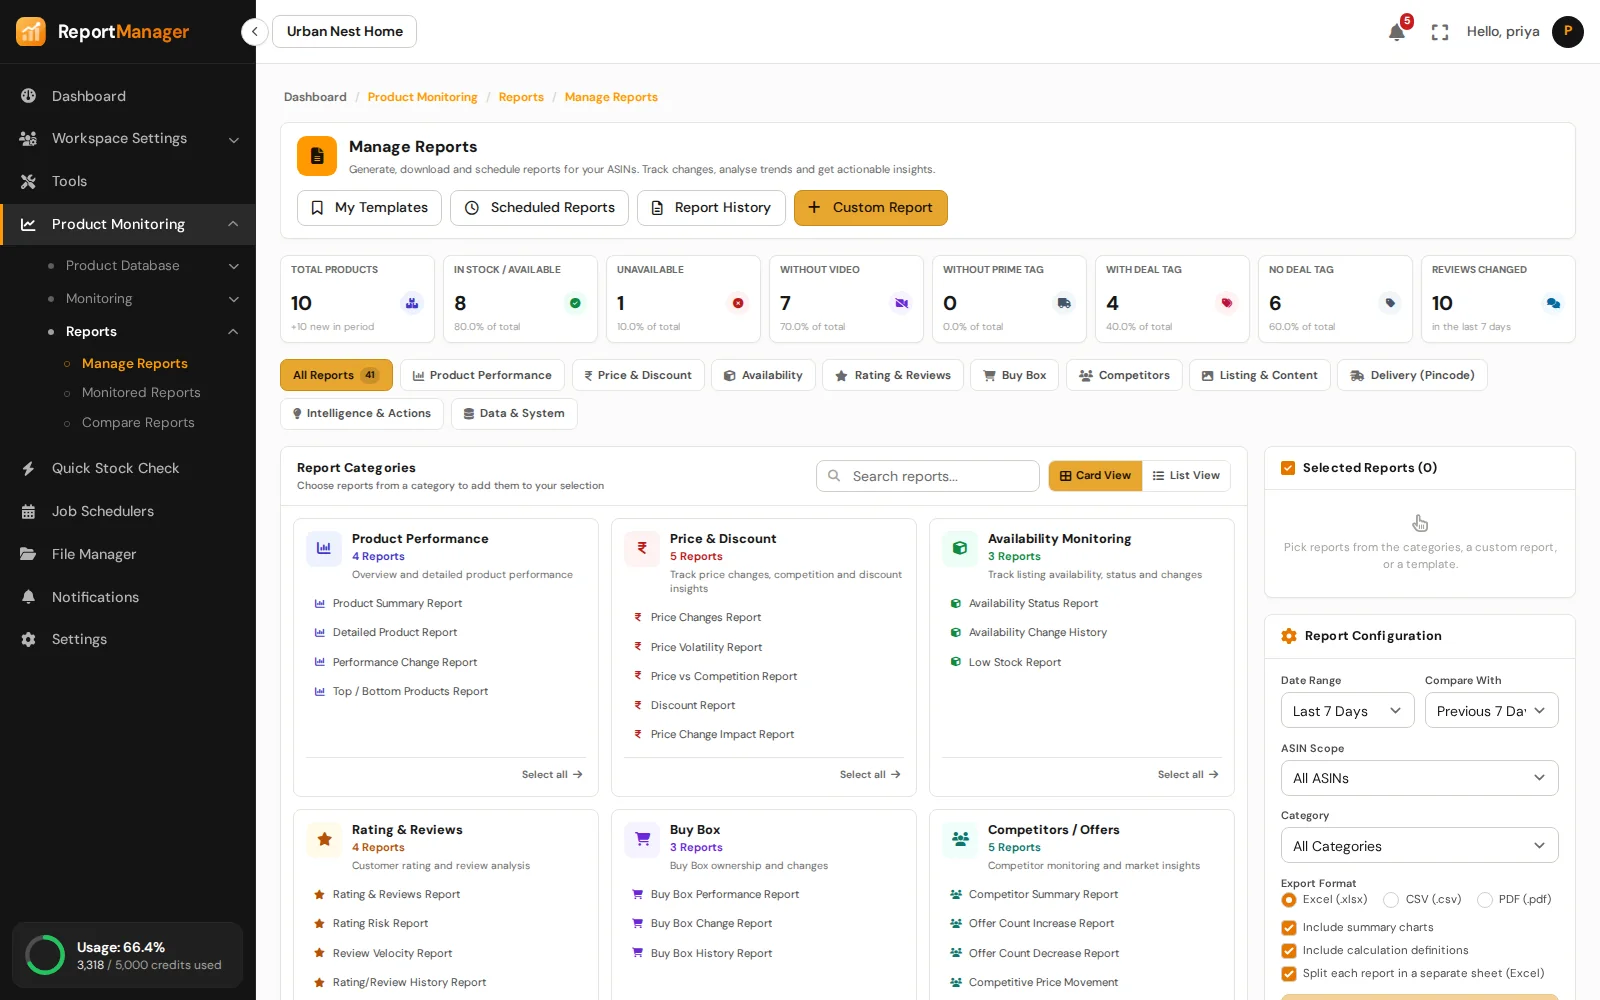
Reports and Comparisons
See what changed since the last run, compare any two reports and export them to Excel.
One per run, with a card per metric showing how many products changed.
Put two dates side by side and see what moved between them.
Every reading of an ASIN, with a chart by day or by reading.
A page per ASIN with price, rank, rating and delivery charts.
Click a card to see only the products with that change.
Reports and grids download as Excel.
How it works
Any stock, competitor or pincode run writes its report when it finishes.
See how many products changed on each metric, and which ones.
Set it against another date, or download it.
Good to know
Product Monitoring
Know the state of every listing.
Watch the listings you compete with.
Delivery promise, pincode by pincode.
Check any ASIN on the spot.
The catalogue at a glance.
Where you win and where you lose.
Get started
Create an account, add your ASINs and schedule the first run.